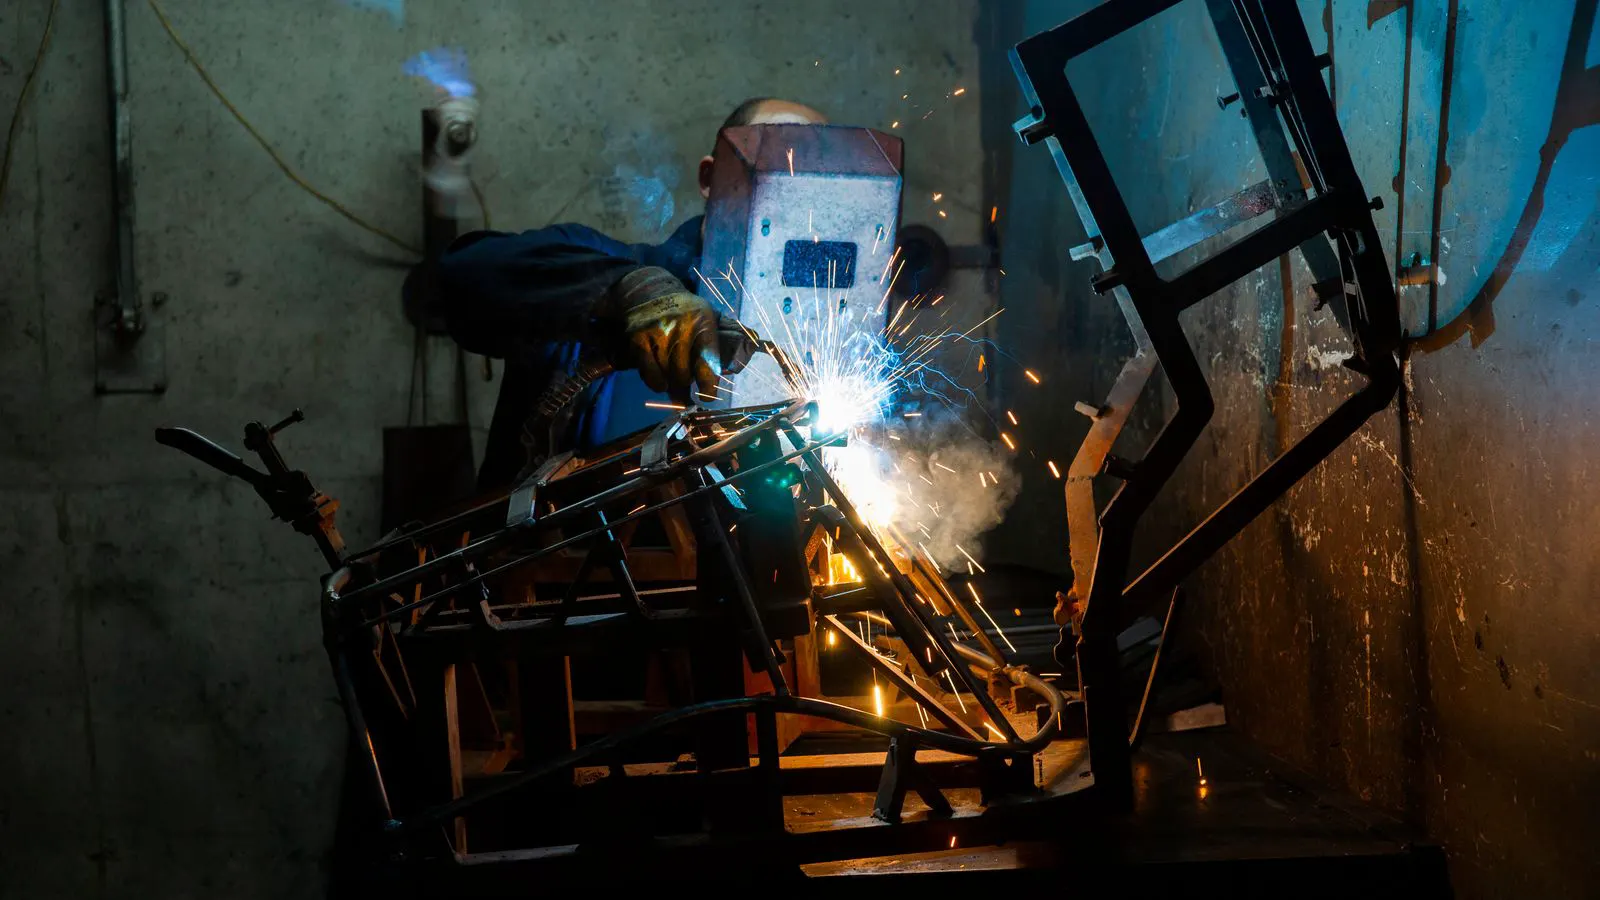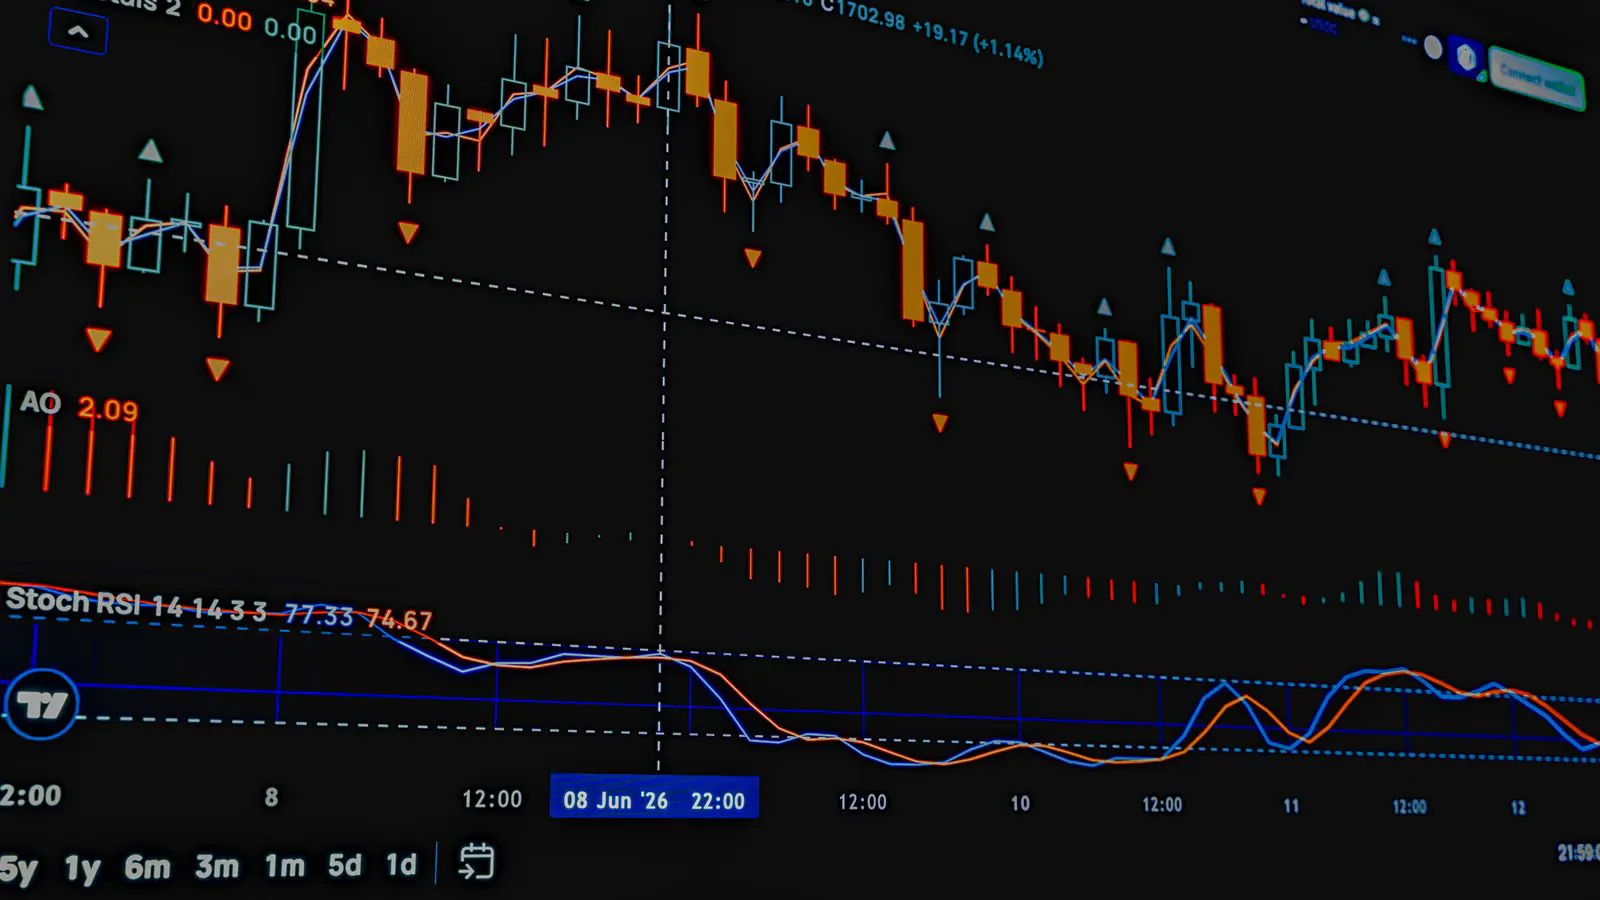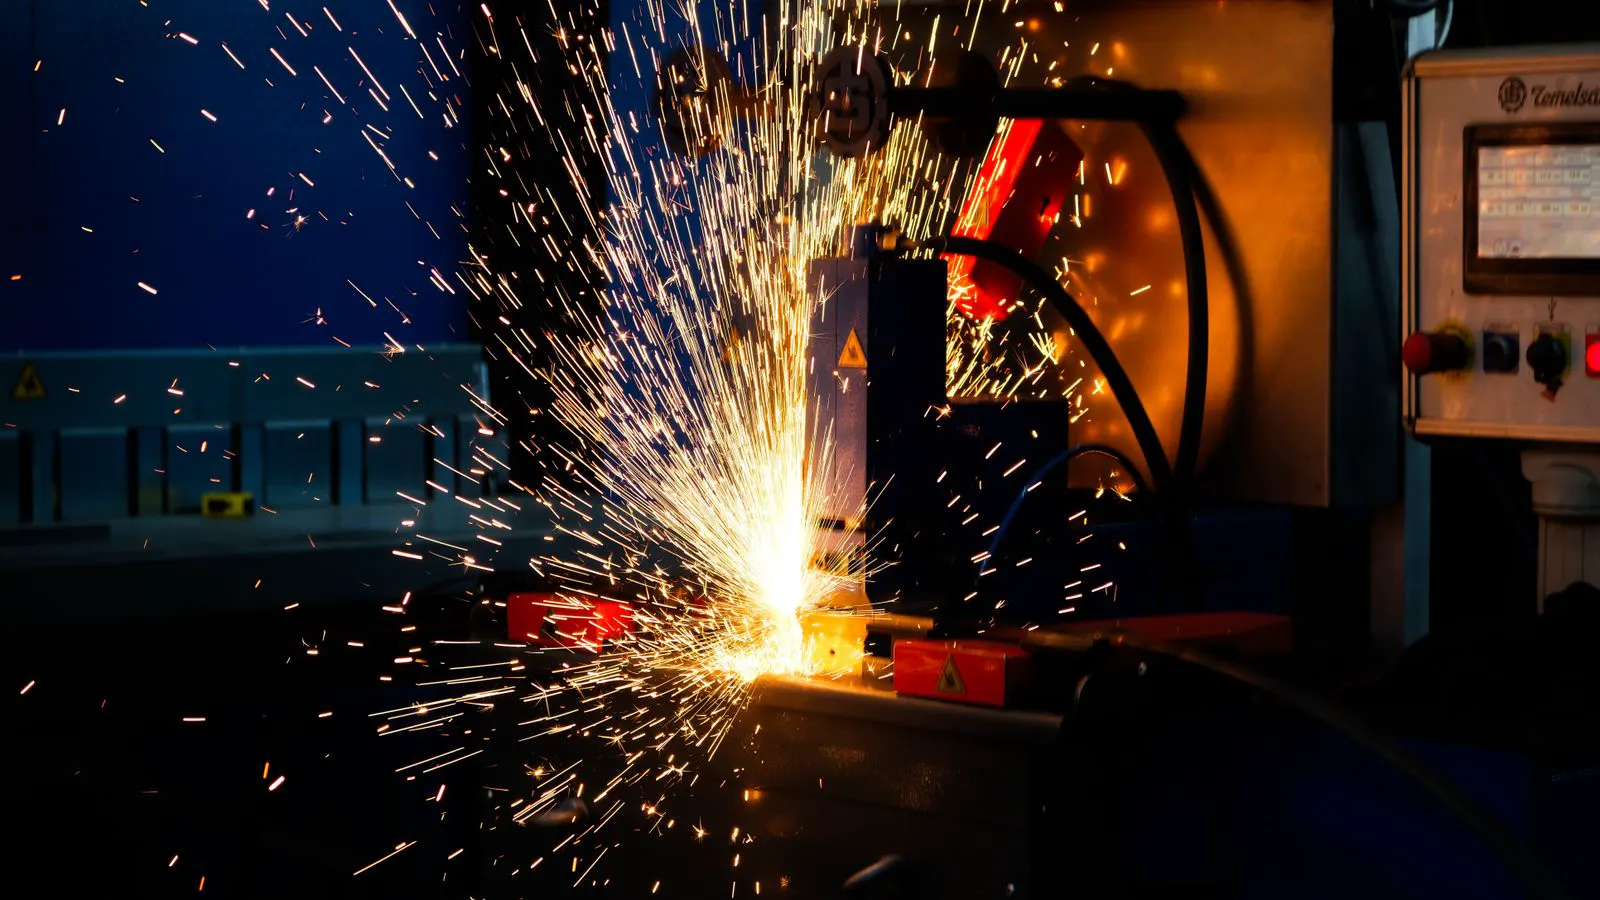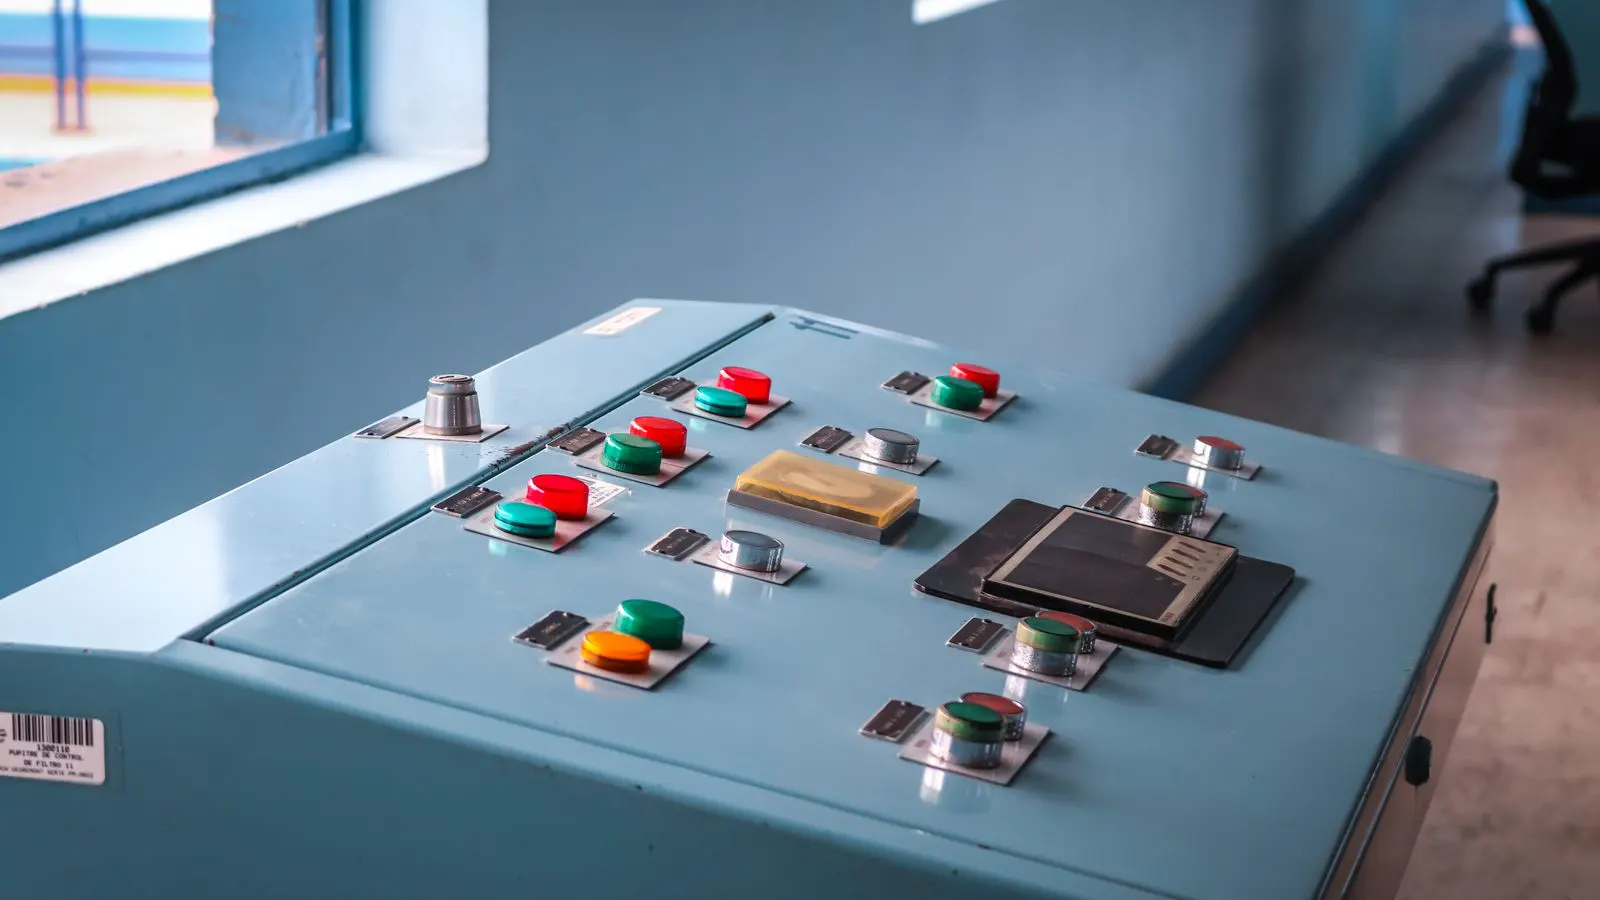
The welding investment value in 2026 comes from energy recovery, smart monitoring, and lower consumable waste. Buyers should track efficiency shifts, model true cost, and pilot new controls to protect return on investment.
- Efficiency gains now come from controls, energy recovery, and consumable management, not just base machine output.
- Buyers should model energy, consumables, and downtime in one cost sheet before purchase.
- Pilot one new control or monitoring feature in a low-risk cell before committing to a full line upgrade.
- Standardize parameters and record data to make future ROI analysis easier.
- Choose equipment that supports firmware updates and clear diagnostics.
What changed in how equipment value is measured
The welding investment value for 2026 is no longer tied only to amperage, duty cycle, or purchase price. Buyers now compare the total cost of a machine over several years of production. That includes power draw, wire feed cost, gas usage, consumable wear, and downtime from unplanned stops.
This shift matters because the base cost of a welder is only one line item. A machine that draws less power and uses less wire per joint can cost more upfront and still be cheaper to run. The same logic applies to consumable life and control features that reduce operator error.
The practical question for buyers is simple. Which technologies lower the cost per joint and which ones add complexity that does not pay back in a realistic timeline.
Which efficiency shifts will drive ROI in 2026
The first shift is energy management. Welding cells with better power factor correction, variable frequency drives, and active cooling can lower peak load and reduce strain on transformers. This is especially visible in facilities that run multiple machines on the same circuit.
The second shift is smart parameter control. Fixed presets are moving toward adjustable profiles that track joint geometry, material thickness, and travel speed. This reduces the need for rework and lowers the amount of excess heat that wastes energy and burns through consumables.
The third shift is consumable tracking. Wire feeders with clearer usage feedback and gas regulators with pressure monitoring help operators see when a machine is running outside its intended window. Small drifts in voltage or gas flow can quietly raise the cost per joint over time.
The fourth shift is predictive maintenance. Machines that log error codes and component wear give maintenance teams a chance to replace a part before it causes a weld failure. This is useful in high-volume shops where one hour of downtime on a line can erase a week of efficiency gains.
The fifth shift is data integration. When machine data feeds into a central dashboard, managers can compare cost per joint across different shifts, operators, and product families. This makes it easier to spot which changes actually improve return on investment.
The sixth shift is modular upgrades. Instead of replacing a whole machine, buyers can add a better controller, a new wire feed unit, or a monitoring module to existing equipment. This is often a cheaper path to higher efficiency than a full replacement.
How to build a real welding ROI analysis
A strong welding ROI analysis starts with a baseline. Record the cost per joint for the current setup, including energy, wire, gas, tips, nozzles, liners, and labor. Do not use a single day. Use a representative week or month that includes both good and poor production conditions.
Next, list the changes you are considering. A new controller, a variable speed wire feed, a power monitoring unit, or a predictive maintenance package each have different cost profiles. Some cost more upfront but save a small amount per joint. Others cost less upfront but save more when downtime is reduced.
The next step is to model the change. Use the same cost per joint method for the new setup. If the new setup uses less wire, the cost per joint drops. If it reduces rework, the labor cost per joint drops. If it shortens changeover time, the machine availability improves.
Finally, compare the total cost over a realistic period. A three to five year model is common. This accounts for the fact that some savings appear quickly while others depend on maintenance discipline and operator training.
A useful rule is to separate the cost of the upgrade from the cost of the data. A machine that gives you clear usage data may not save money on day one, but it makes future decisions easier. That data value should be included in the analysis.
Where the biggest savings usually show up
The table below shows where efficiency gains tend to appear in a typical production welding cell. The exact numbers depend on material, joint design, and production volume.
| Cost area | Typical efficiency driver | What to watch |
|---|---|---|
| Power | Power factor correction, stable voltage | Peak demand charges and transformer load |
| Wire | Consistent feed speed, low spatter | Wire breakage rate and spatter on parts |
| Gas | Proper flow rate, clean regulator | Pressure drift and leaks |
| Consumables | Tip life, liner life | Replacement frequency per joint |
| Labor | Clear presets, fewer adjustments | Operator error and rework time |
| Downtime | Predictive maintenance, clear diagnostics | Unplanned stops and repair cost |
The biggest savings often come from reducing rework. A joint that fails inspection costs more than the weld itself. It costs the machine time, the labor time, the material, and the inspection time. A control system that keeps parameters in a tighter window can reduce that cost more than a small drop in wire price.
The second biggest savings usually come from consumables. A wire feed that runs with less spatter and a cleaner arc can extend tip life and reduce liner wear. This is a quiet but steady savings that adds up over months.
How to prepare your facility before purchasing
Before you buy, standardize the way you measure cost. If every operator uses a different travel speed or voltage, the baseline is weak. Pick a standard for the most common joint type and record it. This gives you a clean reference point when you compare a new machine or a new control package.
Next, check the power side. Look at your current load, your peak demand, and your transformer capacity. If you are near the limit, adding a high-draw machine can push the facility into a higher demand tier. A machine with better power management may avoid that.
Then review the consumable path. Wire feeders, gas regulators, and tip holders are part of the cost. A machine that is easier to clean and maintain often uses consumables more efficiently. A dirty feed path wastes wire and creates defects.
Prepare a pilot plan. Run one new machine or one new control on a low-risk product. Record the cost per joint for a defined period. Compare it to the baseline. If the pilot shows a clear improvement, expand. If it does not, you have learned something without committing to a full line.
What to avoid when evaluating new efficiency claims
Many efficiency claims sound attractive but lack a clear cost model. A vendor may say a feature reduces energy use by a broad percentage without explaining the conditions. A better question is how much the cost per joint drops under your production profile.
Avoid buying a monitoring package that only shows data without giving you a way to act. A screen that shows voltage drift is useful only if it triggers a warning, a shutdown, or a maintenance task. The value is in the action, not the display.
Avoid over-specifying. A high-end control system may offer features that your team will never use. If the controls are more complex than your operators can manage, the cost per joint may go up, not down. Match the technology to the skill level of the people who will run the machines.
Avoid ignoring the service side. A machine that is hard to service can raise downtime. Check the availability of parts, the training required, and the time needed for routine checks. A slightly cheaper machine with a long service response time can be more expensive over time.
How to track the return over time
After the upgrade, track the cost per joint monthly. Use the same method every month. Record energy cost, wire cost, gas cost, consumable cost, and rework cost. Compare it to the baseline.
Review the data with the maintenance team. If a component is wearing faster than expected, look at the settings. If a machine is running hot, check the cooling and the load. Small adjustments can improve efficiency without a new purchase.
Use the data to plan the next upgrade. If the pilot showed a clear return, expand to other cells. If it did not, adjust the parameters or try a different feature. The goal is to make the next decision based on measured results, not on a brochure.
The welding investment value in 2026 is a function of how well you measure, how well you control, and how quickly you can act on the data. The machines that win are not always the most expensive. They are the ones that lower the cost per joint and keep the line running.
Frequently asked questions
What is the fastest way to see a return from a new welding control feature
Look for features that reduce rework or changeover time. These show up quickly in the cost per joint and are easier to measure than small energy savings.
Should I replace an older machine or upgrade the controls
Upgrade the controls when the base machine is still in good condition and the main cost driver is parameter drift or consumable waste. Replace the machine when power draw, duty cycle, or serviceability are the limiting factors.
How do I know if a monitoring package is worth the cost
Check if it gives you a clear alert, a maintenance task, and a way to compare cost per joint over time. If it only displays data without changing behavior, the value is limited.
What should I track first to improve welding ROI
Track the cost per joint using a consistent method. Include energy, consumables, labor, and rework. A clear baseline makes every future comparison more useful.
Is it better to buy the newest machine or a proven one with new controls
A proven machine with new controls is often the better path when the base hardware is still reliable. It gives you efficiency gains with a lower risk than a full replacement.